Strategic Business Intelligence Leader
Malak has had the biggest impact of all the BI consultants I have worked with. It will be very hard to replace her.
I bridge data, strategy, and leadership to help organizations see clearly, decide confidently, and scale intelligently.
I architect BI systems and AI-embedded workflows that leaders actually use — blending analytics, automation, and executive storytelling to drive measurable outcomes.
Positioned for Director of Business Intelligence | Principal Analytics Leader | Head of Analytics / Data Strategy
About Me
Business Intelligence executive in the making, with a strong AI lens.Beyond the metrics and dashboards, here's what makes my approach to Business Intelligence unique and impactful.
What Sets Me Apart?
I don’t deliver analytics for visibility—I deliver strategic outcomes that drive $500M+ decisions and competitive advantage.
I blend deep technical expertise with executive leadership, bridging C-suite vision and hands-on execution to build scalable, high-performing analytics organizations.
🏆 Award-Winning Leadership:
- 🔹 Multiple #1 Global & #1 AMER recognitions-leading teams to deliver world-class analytics solutions
💰 Executive-Level Impact:
- 🔹 Influence $500M+ decisions and drive enterprise-wide initiatives that shape business strategy
⚡ Transformational Builder:
- 🔹 Build organizations from the ground up, establishing best practices and scaling BI capabilities rapidly
🌐 Cross-Functional Expertise:
- 🔹 18+ years leading analytics across cloud infrastructure, manufacturing operations, and financial services—bringing breadth and depth to every challenge.
🤖 Innovation-Driven Mindset:
- 🔹 Pioneer AI-enhanced BI practices-positioning organizations at the forefront of intelligent automation
🎯 Strategic Business Partner:
- 🔹 Partner with executives to define metrics that matter, align teams around shared objectives, and deliver solutions that drive sustainable competitive advantage
🧠 Customer Obsession & Emotional Intelligence:
- 🔹 Lead with empathy, influence, and clarity—aligning stakeholders, accelerating adoption, and ensuring analytics serve real customer and business needs.
📌 This rare combination of strategic clarity, technical rigor, emotional intelligence, and design-level storytelling creates measurable impact wherever I lead.
Who I Partner With
I partner with executives, product leaders, and analytics teams who need more than dashboards — they need clarity, confidence, and results.
I'm most effective when partnering with:
- ✔ Directors & VPs shaping data strategy and operating models
- ✔ Organizations scaling analytics across regions, platforms, or teams
- ✔ Leaders navigating complexity, ambiguity, or high-stakes decisions
Engagements typically involve building decision systems, mentoring teams, and translating strategy into execution — delivering outcomes that are trusted, adopted, and scaled.
Who I am
I'm a Business Intelligence Engineer turning messy, multi-system data into clear, actionable narratives. I blend hands-on technical depth with strategic thinking and executive communication.
From Amazon Web Services to high-stakes enterprise transformations, I've consistently been the bridge between business questions and data-driven answers — designing solutions that are trusted, adopted, and scaled.
- ✔Lead BI initiatives across cloud, manufacturing and banking.
- ✔Partner closely with Directors & VPs to shape metrics that matter.
- ✔Mentor analysts and engineers, raising the bar on data quality and storytelling.
- ✔Built reporting infrastructures from the ground up and scaled BI capabilities across multi-functional teams—establishing best practices that outlive individual projects.
My Zone of Genius
I turn impossible timelines into award-winning outcomes. While most BI professionals specialize in either technical depth or business strategy, I've mastered both—and added rapid learning as my superpower.
Here's what makes me different:
- ✔ Learning Speed: Master tools at competition-grade level in days. Tableau in 2 weeks → Global #1. QuickSight in 5 days → AMER #1 again.
- ✔ Strategic + Technical: Architect ETL pipelines and present to VPs. Write complex SQL and craft executive narratives. Most choose one path—I excel at both.
- ✔ Quality Under Pressure: Best work when stakes are high. Won global competitions, influenced $500M decisions, turned complaints into standing ovations.
- ✔ Industry Fluency: Cloud, manufacturing, banking—I speak multiple industry languages. Cross-pollination drives breakthrough solutions.
- ✔ Emotional Intelligence: Build trust, mentor teams, inspire stakeholders. Turn data skeptics into champions through clear communication.
- ✔ Future-Ready: Using AI—training, building, automating. Preparing for the future of BI while delivering exceptional results today.
The through-line? I deliver work that's trusted, adopted, and scaled—because it's designed to last.
How I use AI in my work
I bring an AI-enhanced approach to Business Intelligence — accelerating insight generation, improving data quality, and enabling smarter decision-making across teams.
- ✔Completed structured AI leadership training focused on applying LLMs in BI workflows and decision-making.
- ✔Use AI to draft user stories, validate metric definitions, and improve BI documentation quality.
- ✔Designed and deployed an AI-powered chatbot using Voiceflow to answer questions about my portfolio, work, and achievements.
- ✔Automate repetitive BI tasks such as data checks, requirement gathering, and stakeholder summaries using LLMs.
- ✔Use AI to enhance data storytelling, create executive slides, and transform technical insights into business clarity.
- ✔Leverage AI for rapid prototyping: dashboard mockups, SQL debugging, and KPI modeling.
Case Studies
Selected examples of how I turn analytics into measurable business outcomes.✦ Highlights at a Glance
What I'm known for as a BI & data strategy leader.
Led the Rack Install Dashboard that reduced P90 install cycle by 50% YoY and supported ~$500M annual savings, improving global visibility for 13K+ ML racks and accelerating EC2 deployment.
Built entire reporting infrastructures from scratch across multiple industries, including automations that enhanced dashboard performance by ≥60%.
At Google, converted a severe negative customer complaint into a full turnaround, becoming the “star of the week” after rebuilding trust and improving delivery processes.
✦Features Impacted Stories
Representative examples of BI work and outcomes.
(Tableau) F1 Formula Dashboard
Demonstrate technical mastering and ability to handle any reporting tool and any data and at any time.Results: AMER #1 and Global #1
(QuickSight) Chef Compass Recipes
Demonstrate my fast learning and storytelling, in days.Result: AMER #1 for 3 consecutive years
Bonus Tips – Free Automation Tools Pack
A curated set of ⬇ FREE DOWNLOAD automation ideas, templates, and tool tips designed to help teams test and scale their own BI workflows.How I Deliver Results
My proven 4-step methodology for transforming analytics into actionDiscover
Discover
Partner with executives to define metrics that matter and align teams around shared objectives
Design
Design
Architect scalable BI systems with AI-enhanced workflows that eliminate manual bottlenecks
Deliver
Deliver
Build decision systems leaders actually use, with clear narratives that drive executive action
Scale
Scale
Establish best practices, mentor teams, and build capabilities that outlive individual projects
AI-Enhanced Approach
I leverage AI to accelerate every phase: validating data quality, drafting user stories, automating repetitive BI tasks, and transforming technical insights into executive narratives that drive decisions.
Recommendations
What leaders, peers and customers say about working with me.Recognitions
How leaders and judges describe my strengths.Professional Timeline
Cloud · Manufacturing · BankingAI Skills & Applications
How I integrate AI into business intelligence.Automate repetitive tasks like validation, data summarization, SQL debugging, and requirement gathering using LLMs — reducing cycle time and improving quality.
Hands-on experience applying AI to analytics, decision-making, workflow automation, and BI storytelling using practical, business-focused methodologies.
Built an AI-powered personal assistant (Voiceflow), an AI avatar video introduction, and AI-assisted dashboards, summaries, and storytelling components integrated throughout this website.
Core Skills & Tooling
Frequently Asked Questions
Find answers to common questions about my services, expertise, and approach to Business Intelligence.What services does Malak Saad offer?
Malak Saad offers Strategic Business Intelligence & Analytics consulting services, including BI strategy development, data analytics consulting, executive data insights, BI systems architecture, and data visualization. With 19+ years of experience, Malak specializes in turning complex data into actionable executive decisions using tools like Tableau, Power BI, QuickSight, Azure, and AI-enhanced analytics.
What awards and recognitions has Malak Saad received?
Malak Saad is a #1 Global AWS Analyticon Leader and #1 AMER AWS Analyticon Leader, winning multiple consecutive Analyticon competitions. These awards recognize excellence in data visualization, storytelling, and analytics innovation.
What tools and technologies does Malak Saad specialize in?
Malak Saad specializes in Tableau, QuickSight, Power BI, Azure Analytics, SQL, AWS services (Athena, Redshift, S3, Glue), ETL/Data Pipelines, Airflow, and AI-enhanced analytics platforms. Additionally, Malak is experienced in Excel/VBA automation, data modeling, and BI systems architecture.
How can I contact Malak Saad for consulting services?
You can contact Malak Saad through the contact form on this website, or connect via LinkedIn. Malak welcomes conversations about innovative BI projects, industry insights, mentoring opportunities, and thought leadership in the data analytics space.
What makes Malak Saad's approach to Business Intelligence unique?
Malak Saad's approach emphasizes executive storytelling and results-driven analytics. Rather than just delivering data, Malak focuses on delivering actionable insights that drive business decisions. This includes AI-enhanced workflows, cross-functional leadership, and a proven track record of winning analytics competitions and delivering measurable business impact.
Does Malak Saad offer automation tools or resources?
Yes, Malak Saad has created free automation tools including interactive email automations and Excel/VBA mini-tools designed to streamline BI workflows. These lightweight tools can be plugged directly into daily work to save time and reduce manual steps.
How long does a typical BI consulting project take?
Project timelines vary based on scope and complexity. Typical BI strategy projects range from 2-4 weeks, while full BI system implementations can take 3-6 months. Quick analytics dashboards and proof-of-concepts can be delivered in days to weeks. Malak works efficiently with teams to establish realistic timelines that balance quality with speed.
What is the difference between Tableau, Power BI, and QuickSight?
Tableau excels in advanced visualizations and exploratory analysis, Power BI integrates deeply with Microsoft ecosystems and offers strong enterprise features, while QuickSight is optimized for AWS environments with serverless scalability. Malak has won awards with all three platforms and can help you choose the right tool based on your data infrastructure, team skills, and business requirements.
Does Malak Saad work with startups or only large enterprises?
Malak Saad works with organizations of all sizes, from startups to Fortune 500 companies. The approach is tailored to each organization's needs—startups benefit from quick, scalable solutions that grow with them, while enterprises get strategic BI architecture that integrates with existing systems. Previous clients include AWS, Google, TCS, and various financial institutions.
How does AI-enhanced analytics differ from traditional BI?
AI-enhanced analytics automates insights discovery, predictive modeling, and natural language querying, going beyond traditional dashboards. Malak integrates AI to accelerate BI delivery, automate validation, summarize data, and enhance executive storytelling. This approach reduces manual work while providing deeper, faster insights for decision-making.
What industries does Malak Saad have experience in?
Malak Saad has extensive experience across multiple industries including cloud services (AWS), technology (Google), financial services (NCB, Bank Al-Jazira), consulting (TCS), and manufacturing (Lake Cable). This cross-industry experience brings diverse perspectives and proven methodologies that work across different business contexts and data challenges.
Let’s Connect
Open to opportunities, collaborations, and meaningful connections that drive impact.A professional point of contact for meaningful conversations in analytics leadership, data strategy, operational excellence, and the evolving role of AI in BI.
I value connecting with leaders, builders, and curious minds across that lead to impactful work, whether through full-time roles, consulting engagements, thought leadership collaborations, or mentoring relationships.
If you'd like to discuss innovative projects, industry insights, mentoring, or thought leadership opportunities, feel free to reach out! I'm happpy to discuss opportunities in analytics leadership, data strategy, operational excellence, and the evolving role of AI in BI.
(Tableau) F1 Formula Dashboard
Demonstrate: Technical mastering and ability to handle any reporting tool and any data and at any time.
Results: AMER #1 and Global #1
(Tableau) F1 Formula Dashboard
This dashboard was my first Analyticon Global Competition entry at Amazon. I had just joined AWS and was only three months into onboarding. Although I already knew more than 15 reporting tools, Tableau was brand new to me.
We were a team of 4, where each one of us took ownership of a tab, mine was the "Circuit" Dashboard.
In this Circuit dashboard, my goal was to transform raw telemetry into a decision-ready narrative. Within two weeks, I've learned tableau from scratch while simultaneously developing domain expertise in Formula 1, which I knew nothing about at the start.I studied how circuits work, how drivers behave during cornering, braking, acceleration, and even met with F1 fans to understand what matters to them. That immersion helped me ‘feel’ the data so I could design a dashboard that mirrors how true F1 analysts think.
What makes this tab unique:
- Designed a clear, intuitive storytelling flow that guides users from overall circuit layout to detailed driver and corner-level strategy.
- Applied advanced Tableau techniques—calculated fields, nested table calcs, COD expressions, blending, and custom logic—to reveal insights not visible in the raw data.
- Built highly interactive from real live circuit pictures, synchronized visuals with parameters, filters, hover effects, and real circuit images to give users a cohesive, real-time performance view. Also, created an analytical flow that moves from macro circuit behavior -> micro corner-level analysis seamlessly
- Delivered an analytical experience with color-coding, geometry-based visuals, rich tooltips, and deep-dive CTAs, earning strong appreciation and recognition.
- Ensured all visuals update cohesively, giving users a complete performance picture in seconds and making you feel you are in the race.
The result: we won Win #1 🏆 in AMER and Win #1 Globally in the Analyticon competition. This project became the foundation of my Tableau journey at AWS and a reference point for future winning dashboards.
Beyond the trophy, this dashboard proved how quickly I could ramp up on a new tool, collaborate under tight timelines, and still deliver a polished, competition‑grade storytelling experience.
(QuickSight) Chef Compass Recipes
Demonstrate: Fast learning and storytelling, in days.
Result: AMER #1 for 3 consecutive years
(QuickSight) Chef Compass Recipes
For the third consecutive Analyticon round, our management requested from us to do something different: build the winning dashboard in QuickSight instead of Tableau. At the same time, the business was planning a broader move toward QuickSight for operational reporting, so this project became both a competition entry and an internal proof‑of‑concept.
Under heavy workload and with only a few days available, I learned the QuickSight stack and helped build the Chef Compass - "Navigate" Tab dashboard within five days — from data exploration to a polished experience that judges could immediately understand and navigate.
Judges highlighted several specific strengths:
- Clean design, informative content, and intuitive navigation, with a color theme and aesthetics that created a strong overall user experience.
- The "Navigate" tab gave a fun and effective way to explore a vast dataset of around 69,000 recipes, with out of the box thinking and creativity.
- Strong overall functionality, including a glossary, well‑designed tables, and effective visuals such as the waterfall chart and health‑score gauges — elements that made Chef Compass a standout entry and deserving of its place as a finalist.
The results: Winner #1 🏆 AMER Analyticon VizCon again — making it three consecutive years of Analyticon wins. Judges highlighted the clean theme, storytelling, and the way the dashboard balanced aesthetics with business impact.
Behind the scenes, I put in long hours prototyping layouts, tuning interactions, and using clever QuickSight techniques — parameters, calculated fields, and guided navigation — to keep the story clear and impactful. That mix of hard work, rapid learning, and thoughtful design was instrumental in the dashboard's victory.
Bonus Tips – Free Automation Tools Pack
Coding travel everywhere and in any reporting tool!
This section will host downloadable files I personally built — fun, interactive automation helpers designed to make your BI workflow faster and more enjoyable. These are lightweight Excel / VBA mini-tools thatyou can plug directly into your daily work to save time, reduce manual steps in just "one-click" ! Feel free to download them to try clever automation techniques without needing engineering support.
-
1) Interactive email automations that draft, format, and personalize recurring communications.The goal of this tool is to automate the emailing process and communication directly within Excel, allowing users to just fillup the information, and in 1 click button, the email will be automatically sent in the same layout and font as you nade it without any single code interference.
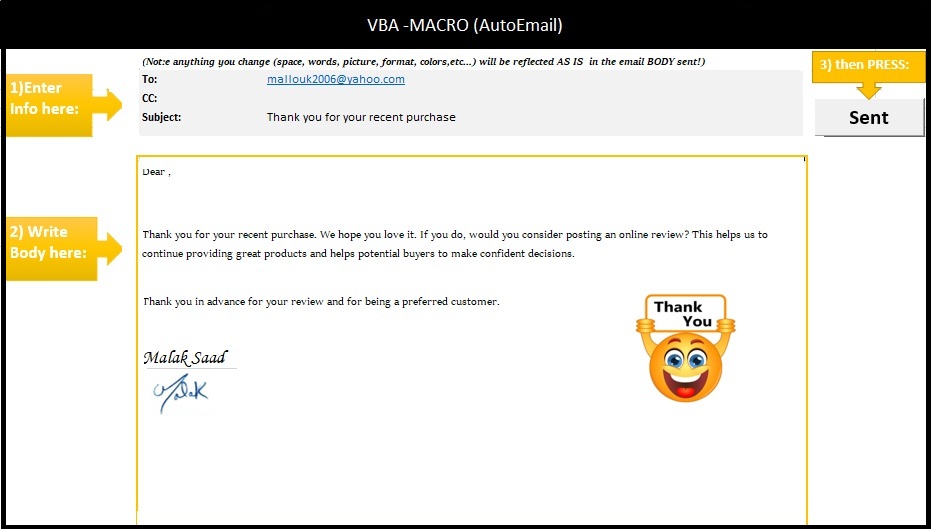 Download Tool
(Note: this file works only for Classic Outlook.)
Why This Tool Feels Talented or Advanced?
It combines smart scheduling logic with automatic email notifications, turning a simple Excel file into a mini workflow system. The tool removes manual follow-ups, email will be sent exactly as you see, prevents scheduling conflicts, and ensures that updates are instantly communicated — something traditional Excel files cannot do on their own.
-
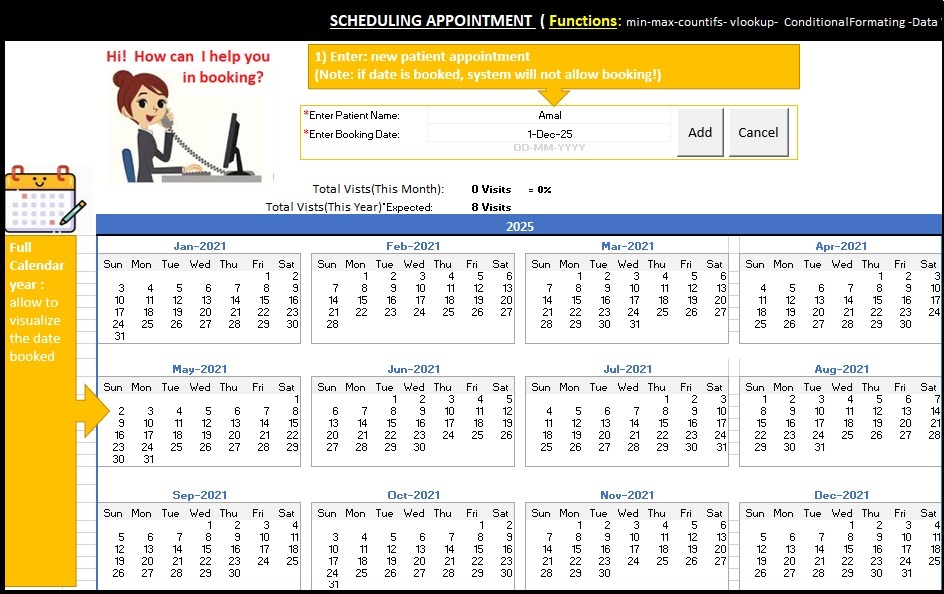
2) Scheduling appointment that helps users automate and optimize task scheduling directly in Excel.The goal of this tool is to automate scheduling and communication directly within Excel, allowing users to manage tasks, assign resources, track timelines, generate a conflict-free schedule with a single click, and automate planning system that saves time and improves accuracy.
The macro engine analyzes dates, priorities, and dependencies to build an accurate timeline without manual effort. It also visualizes the schedule, highlights issues, and keeps everything up-to-date instantly.
Why This Tool Feels Talented or Advanced?
Because it automates what people usually do manually:
- Automatically assigning resources
- Auto-calculating overlaps
- Auto-coloring conflicts
- Auto-refreshing timelines
- Running macro-driven scheduling logic
- Reducing human error
- Producing professional insights instantly
This makes the user look like they're using a mini scheduling system, not just Excel.